


Isaac Gerber
Retailers face myriad challenges and decisions almost daily. Top among these is understanding consumer preferences and how those change over time. Yesterday’s hot product may be in tomorrow’s discount bin, and getting ahead of consumers’ changing whims can help you get the most out of one of your most limited assets: your shelves.
Online searches can give retailers and brands a powerful view into what consumers care about and how that changes over time. After all, people don’t lie to their search bar.
Lining the shelves
To best understand the current drivers of the market, and how consumer interest is changing over time, we took a look at the top brands across 10 major product categories typically carried at drug stores. These are personal care, beauty, nutritional supplements, first aid, baby care, oral hygiene, skin care, food & beverage, feminine care and over-the-counter medication. We started by taking a birds-eye view of each of these categories to see how interest has changed from last February through this February, looking at the change in overall share of search between these product categories. Share of search is the percent of each category relative to the total amount of searches across categories. Share of search helps us to understand how overall interest between brands, categories or topics changes over time.
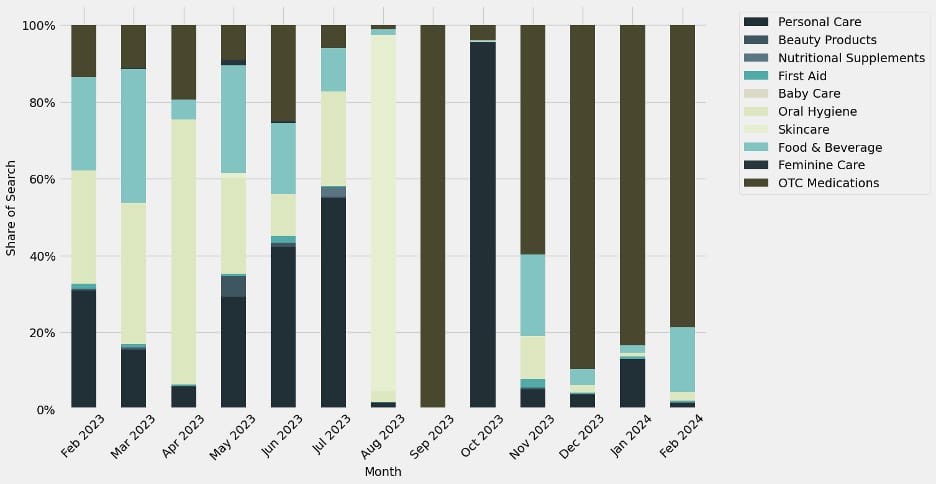
Fig 1: Share of Search Interest in Major Drug Store Product Categories, Feb. 2023 – Feb. 2024
Looking at this in Figure 1, we see a market in major flux. Share of search changes significantly over time, and in many cases even month to month, showing that consumer preference is a moving target. Now, some of these trends might be immediately obvious — for example, Skin Care peaks decisively in sunny August — but others may be more subtle.
Driving the change
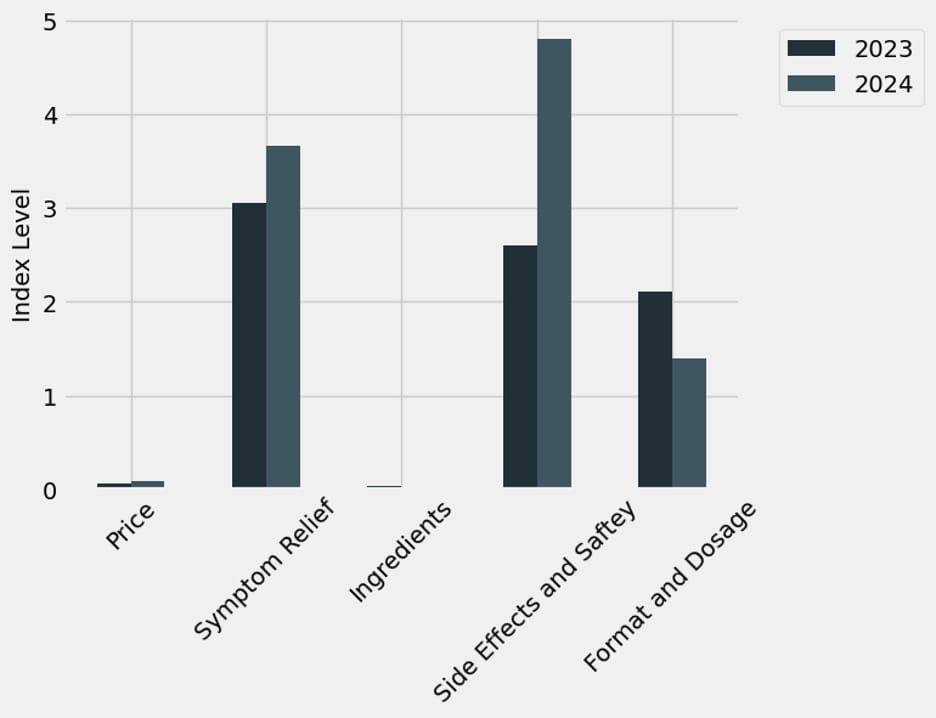
Fig 2: O-T-C Medication Attributes, Feb. 2023 – Feb. 2024
One notable example is September of 2023. We see that O-T-C medications essentially own the share of search for the month of September. Search data lets us dive in and understand not just the big picture, but what’s driving it. It turns out that the September spike was driven by the FDA’s announcement that certain cold medications are ineffective and may end up being taken off of retailer shelves. A significant amount of online searches happened as a result of this ruling, peaking in September shortly after the news first broke. And while this subsides to an extent over the following months, interest in O-T-C medication is still over two times its average share of search for the last three months.
What’s driving this increase in interest? Search data once again lets us dive in and see what people are interested in most. By looking at data for the month of February in 2023 compared to 2024 an interesting picture emerges about how preferences have changed for consumers seeking out O-T-C medications.
Figure 2 shows us the attributes related to O-T-C medication searches. What this tells us is when people search for O-T-C medication, what related keywords are included in that search. In other words, what are the specific things that they’re interested in when it comes to O-T-C medication.
There’s a lot of useful insight here. First off, neither price nor ingredients/formulation were important factors in consumer interest last year, nor are they this year. Even more interesting, we see a clear shift in importance over the course of the year. We see that in 2023 the most important attribute was symptom relief — validating that the medication is helpful to treat a specific condition such as a headache, heartburn, etc. While that’s still an important consideration, we see that interest in side effects and general drug safety has increased by about 85% year over year. Consumers are much more interested in the safety of the medication they’re buying and taking. Even though the FDA advisory on cold medication didn’t say that the medication was unsafe, this is now a potentially unexpected effect of that advisory: Consumers are now digging in deeper to understand the safety of the medication on your store shelves. This means that helping consumers find the information that they want about safety will ultimately make them feel better about the product and more likely to purchase it.
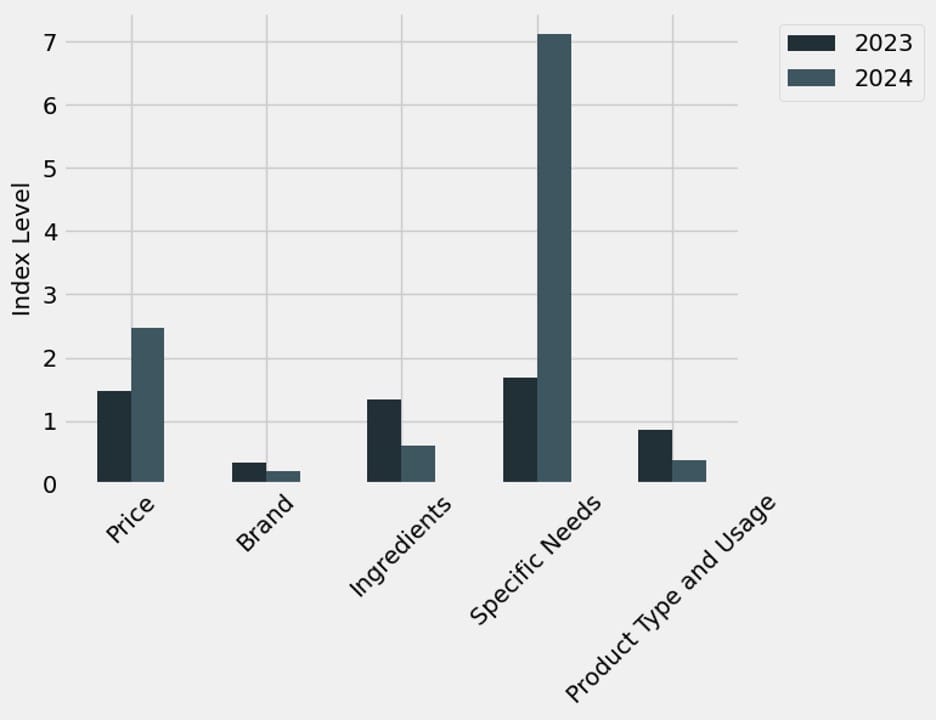
Fig 3: Personal Care Attributes, Feb. 2023 – Feb. 2024
Let’s now turn to the personal care category. As we saw in Figure 1, personal care products — such as deodorants, hair care products and similar, was the top category for much of the year before the September advisory. What can search data tell us about how the market’s changed for this category?
First off, we see that price is a much more important attribute for this category than O-T-C medication. That might be intuitive — when it comes to medication, people are looking to treat a symptom and therefore may care much less about price. For a personal care product, price is more likely to be a consideration when choosing and purchasing something.
The biggest change though, is a spike in interest for specific needs. Specific needs is our way of grouping together common product specifics such as suitable for sensitive skin, hypoallergenic or suitable for acne-prone individuals. Interest in this attribute has increased by over 300% year over year, underlining the increase in importance for consumers, and once again how important it is to stay on top of consumer preferences.
As we’ve seen, consumer preferences are changing constantly. If you don’t stay on top of it, it’s easy to miss a sea change in terms of what people care about and why they care about it. By using search data as part of your planning process, you can better understand shifting consumer preferences and position yourself and your store for success.
Isaac Gerber is global director of insights and analytics at Captify.


